Summary: Teacher pay has suffered a sharp decline compared with the pay of other college-educated workers. On average, teachers made 26.4% less than other similarly educated professionals in 2022—the lowest level since 1960.
Teachers have one of the most consequential jobs in the country—they have the future of the U.S. in front of them every day. But teaching is becoming a less appealing career choice for new college graduates. Not only are levels of compensation low, but teaching is becoming increasingly stressful as teachers are forced to navigate battles over curriculum and COVID-19 related mandates as well as rising incidence of violence in schools.
Low pay makes recruiting and retaining highly qualified teachers difficult. A lack of well-qualified teachers means we cannot equip future tech innovators, researchers, and educators with the training they need to emerge as leaders.
The downward trend in teacher pay must be reversed. Local and state politicians and community members can show respect for the profession by significantly boosting teacher pay. Targeted policy action is needed on school funding as well. State and local governments will require federal support to maintain and improve resources for schools. Finally, public-sector collective bargaining should be expanded since unions can advocate for improved job quality and a higher level of resources.
The teaching profession once had a somewhat captive labor pool of women to depend on. That is no longer the case.
I s the United States compensating teachers at a sufficient level to retain current staff and recruit a highly skilled pool of future college students into the profession? My former co-authors and I have been concerned with this question for the last two decades.1 We have been warning for years that the worsening trends documented in this series have become a significant and growing challenge for the teaching profession.
Because public school teachers must attain at least a bachelor’s degree to teach in the U.S., this research compares teachers with college graduates working in other professions. Providing teachers with compensation commensurate with that of other similarly educated and experienced professionals is necessary to retain and attract qualified workers into the profession. Over the past two decades, the weekly wages and total compensation of public school teachers have fallen further and further behind. This update adds 2022 data to this long-running series.
The report uses two sources of data, both from the Bureau of Labor Statistics (BLS), to analyze public school teachers and other nonteaching college graduates. A prior report provides a comprehensive discussion of the data and methodologies that were used to produce our teacher weekly wage and total compensation estimates (Allegretto and Mishel 2019, Appendix A). The following is a concise summary of that discussion.
First, I use Current Population Survey Outgoing Rotation Groups (CPS-ORG) data for the wage analyses. To account for the “summers off” issue for teachers, I focus on weekly wages, which avoids comparisons of weekly hours worked or length of the work year between teachers and other college graduates.2 The sample is restricted to full-time workers (working at least 35 hours per week), 18 to 64 years old, with at least a bachelor’s degree. The education restriction is made because teachers today need at least a bachelor’s degree to teach. The sample is further limited to those who reported their wage information directly (those who didn’t respond and whose wages were estimated by BLS are excluded).3
To preserve data confidentiality, the Bureau of Labor Statistics records weekly wages only up to a defined threshold, so the wage amounts above this threshold aren’t specifically identifiable in the data. This is called top-coding. The threshold, however, has not been updated for inflation since 1998. As a result, more workers are assigned top-coded wages, which has generated a growing understatement of college graduate wages relative to those of teachers. EPI replaces original top-coded values with Pareto-distribution implied means above the CPS top-code for men and women.4
The second data source used to assess benefits is from BLS’s National Compensation Survey’s Employer Costs for Employee Compensation (ECEC) program. Specifically, I pull data on employer costs per hour worked for detailed categories of compensation for “primary, secondary, and special education schoolteachers” in the public sector and “civilian professionals”—the latter being the broadest category available that largely corresponds to college graduates. “Benefits” in my analysis refer to employer costs for health and life insurance, retirement plans, and payroll taxes (covering Social Security, unemployment insurance, and workers’ compensation).
The remaining components of compensation are “W-2 wages,” a wage measure that corresponds to the wages captured in the Current Population Survey data used above. W-2 wages are the wages reported to employees and to the Internal Revenue Service. They include “direct wages,” defined by the Bureau of Labor Statistics as “regular payments from the employer to the employee as compensation for straight-time hourly work, or for any salaried work performed” and other wage items, including “supplemental pay.” Supplemental pay includes premium pay for overtime, bonus pay, profit-sharing, and “paid leave.”
The results of this research are presented in four sections. I first show the trends in the simple (not regression-adjusted) average weekly wages for public school teachers and other college graduates from 1979 through 2022 (adjusted for inflation). Second, I report annual estimates of the national weekly wage penalty for teachers using standard regression techniques, which control for systematic differences in age, education, state of residence, and other factors known to affect wage rates—referred to throughout as “relative” differences. Third, I present relative (or regression-adjusted) estimates of the teacher wage penalty for each state and the District of Columbia. Lastly, I factor in nonwage benefits to estimate a total compensation penalty that takes into account the estimated teacher wage penalty along with the teacher benefits advantage to estimate a total compensation differential at the national level (which is not possible to calculate for each state).
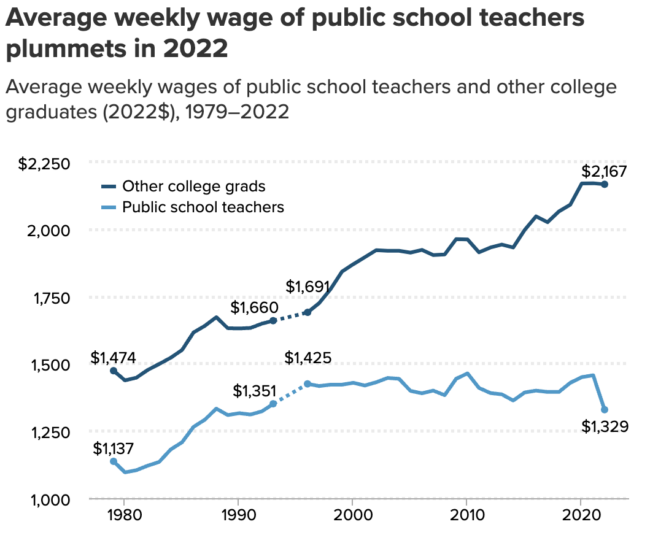
I start by showing the simple level of average weekly wages of public school teachers and other college graduates in Figure A. These data are national annual averages for the two groups adjusted only for inflation (not regression adjusted).
| Year | Public school teachers | Other college grads | Public school teachers | Other college grads | Public school teachers | Other college grads |
|---|---|---|---|---|---|---|
| 1979 | $1,137 | $1,474 | ||||
| 1980 | $1,096 | $1,438 | ||||
| 1981 | $1,104 | $1,448 | ||||
| 1982 | $1,121 | $1,477 | ||||
| 1983 | $1,135 | $1,499 | ||||
| 1984 | $1,181 | $1,522 | ||||
| 1985 | $1,208 | $1,551 | ||||
| 1986 | $1,265 | $1,616 | ||||
| 1987 | $1,292 | $1,641 | ||||
| 1988 | $1,333 | $1,673 | ||||
| 1989 | $1,309 | $1,632 | ||||
| 1990 | $1,316 | $1,631 | ||||
| 1991 | $1,311 | $1,633 | ||||
| 1992 | $1,323 | $1,649 | ||||
| 1993 | $1,351 | $1,660 | $1,351 | $1,660 | ||
| 1994 | $1,376 | $1,670 | ||||
| 1995 | $1,400 | $1,680 | ||||
| 1996 | $1,425 | $1,691 | $1,425 | $1,691 | ||
| 1997 | $1,417 | $1,725 | ||||
| 1998 | $1,422 | $1,777 | ||||
| 1999 | $1,422 | $1,842 | ||||
| 2000 | $1,429 | $1,870 | ||||
| 2001 | $1,419 | $1,896 | ||||
| 2002 | $1,431 | $1,922 | ||||
| 2003 | $1,447 | $1,920 | ||||
| 2004 | $1,444 | $1,920 | ||||
| 2005 | $1,399 | $1,913 | ||||
| 2006 | $1,390 | $1,923 | ||||
| 2007 | $1,400 | $1,904 | ||||
| 2008 | $1,383 | $1,906 | ||||
| 2009 | $1,444 | $1,963 | ||||
| 2010 | $1,464 | $1,962 | ||||
| 2011 | $1,410 | $1,914 | ||||
| 2012 | $1,391 | $1,932 | ||||
| 2013 | $1,386 | $1,943 | ||||
| 2014 | $1,363 | $1,932 | ||||
| 2015 | $1,393 | $1,997 | ||||
| 2016 | $1,400 | $2,048 | ||||
| 2017 | $1,395 | $2,026 | ||||
| 2018 | $1,395 | $2,066 | ||||
| 2019 | $1,429 | $2,091 | ||||
| 2020 | $1,450 | $2,170 | ||||
| 2021 | $1,457 | $2,171 | ||||
| 2022 | $1,329 | $2,167 |
The data below can be saved or copied directly into Excel.
The data underlying the figure.
Notes: Figure shows average weekly wages (2022$) of public school teachers (elementary, middle, and secondary) and other college graduate (nonteacher) peers. Data points for 1994 and 1995 are unavailable; dotted lines represent interpolated data. See Allegretto and Mishel 2019, Appendix A, for more details on data and methodology.
Source: Author’s analysis of Current Population Survey Outgoing Rotation Group data accessed via the EPI Current Population Survey Extracts, Version 1.0.41 (EPI 2023a), https://microdata.epi.org.
Copy the code below to embed this chart on your website.
The first thing to note in Figure A is the significant drop in teachers’ weekly wages from 2021 to 2022. Keep in mind these wages are “real,” meaning that they are adjusted for inflation. In 2022 inflation was 8.1%—the highest level since 1981 and more than three times as high as inflation has been in recent years. For context, annual inflation averaged just 2.2% over the previous two decades.5 To put it another way, high inflation reduced the buying power of teachers in 2022.
A second point to note is how flat real wages for teachers have been for decades. This means that modest nominal increases in weekly wages—increases that haven’t been adjusted for inflation—were similar to increases in inflation. In effect, high inflation cancels out the benefits of modest wage increases. Although wages may rise, prices rise even more because of inflation. In order for there to be increases in standards of living, nominal increases in pay need to exceed the rate of inflation—something that teachers, on average, have not experienced for a long time.
Between 1979 and 1993, the average weekly wage of teachers was below that of other college graduates, but for the most part, the wages of teachers and other college graduates trended together6 until 1996 when they began diverging considerably. In 1996, the inflation-adjusted average weekly wage of teachers was 15.7% less than that of other college graduates. That difference grew by 23 percentage points to 38.7% in 2022.
From 2021 to 2022, real wages for teachers fell by a bit more than inflation (8.8% vs 8.1%), meaning that the lion’s share of the decline was due to inflation, not a large drop in nominal wages. Regardless, the buying power of teachers took a big hit, and significant future pay increases will be needed to recoup the large loss. This was not the case for the earnings of other college graduates as weekly wages, on average, just about kept pace with the large increase in inflation.
This dynamic is likely explained (at least in part) because teachers’ wages are often set by long-term union contracts and dependent on government budgets. In contrast, the private sector can often respond more quickly to improving or deteriorating economic conditions by adjusting wages. Other college graduates were able to garner an increase in nominal wages to keep pace with inflation, thereby keeping their buying power relatively steady in 2022. Future increases in teacher pay—that are significantly above future annual rates of inflation—are needed to recoup the large loss of buying power that occurred in 2022.
The weekly wages discussed above are simple averages (not regression-adjusted) for teachers and other college graduates. However, the two groups may differ fundamentally in factors that typically affect pay on margins such as age, educational attainment, race/ethnicity, and state of residence. For instance, all else being equal, one would expect experienced workers to earn more than young workers just starting out in their careers. Therefore, controlling for age within a regression model will account for such differences across the two samples. Thus, standard regression techniques are used to estimate weekly wages of public school teachers relative to other similarly situated college graduates in the labor market, which can provide an apples-to-apples comparison of earnings.7 I report regression-adjusted estimates for all teachers (which includes a gender control), as well as separately for women and men.
Relative wage results are presented to show how much less (or more) teachers earn in weekly wages relative to other college graduates estimated via regression analysis. A weekly wage “penalty” for teachers is reported when the regression estimates suggest that teachers, all else being equal, are paid less than other college graduates. A penalty appears as a negative number in Figure B. When teachers are paid relatively more, the number is positive and is referenced as a “premium.”
| Year | All | Women | Men | All | Women | Men | All | Women | Men |
|---|---|---|---|---|---|---|---|---|---|
| 1979 | -7.1% | 6.5% | -16.6% | ||||||
| 1980 | -9.30% | 4.50% | -19.20% | ||||||
| 1981 | -10.10% | 3.10% | -19.00% | ||||||
| 1982 | -10.20% | 2.80% | -19.40% | ||||||
| 1983 | -11.80% | 1.00% | -20.70% | ||||||
| 1984 | -10.00% | 2.50% | -19.70% | ||||||
| 1985 | -10.20% | 1.90% | -19.50% | ||||||
| 1986 | -8.80% | 3.20% | -18.40% | ||||||
| 1987 | -7.90% | 3.90% | -18.10% | ||||||
| 1988 | -8.00% | 5.10% | -18.20% | ||||||
| 1989 | -8.20% | 3.00% | -17.00% | ||||||
| 1990 | -7.70% | 4.00% | -17.90% | ||||||
| 1991 | -9.10% | 0.60% | -16.30% | ||||||
| 1992 | -7.00% | 3.10% | -15.60% | ||||||
| 1993 | -5.1% | 4.1% | -13.1% | -5.10% | 4.10% | -13.10% | |||
| 1994 | -5.40% | 2.70% | -13.70% | ||||||
| 1995 | -5.70% | 1.30% | -14.40% | ||||||
| 1996 | -6.1% | -0.1% | -15.1% | -6.1% | -0.1% | -15.1% | |||
| 1997 | -6.20% | 1.20% | -18.60% | ||||||
| 1998 | -9.00% | -1.50% | -20.50% | ||||||
| 1999 | -10.40% | -2.70% | -21.70% | ||||||
| 2000 | -11.80% | -5.10% | -22.70% | ||||||
| 2001 | -12.10% | -4.00% | -25.30% | ||||||
| 2002 | -12.10% | -5.10% | -24.10% | ||||||
| 2003 | -11.30% | -4.90% | -21.20% | ||||||
| 2004 | -12.80% | -6.20% | -23.30% | ||||||
| 2005 | -13.30% | -6.30% | -24.50% | ||||||
| 2006 | -15.00% | -8.00% | -27.30% | ||||||
| 2007 | -11.70% | -4.70% | -23.40% | ||||||
| 2008 | -14.50% | -7.70% | -25.70% | ||||||
| 2009 | -12.50% | -4.50% | -24.70% | ||||||
| 2010 | -11.90% | -4.60% | -23.70% | ||||||
| 2011 | -12.80% | -6.40% | -24.20% | ||||||
| 2012 | -16.00% | -10.00% | -26.20% | ||||||
| 2013 | -16.40% | -10.10% | -27.30% | ||||||
| 2014 | -16.50% | -10.50% | -26.20% | ||||||
| 2015 | -18.40% | -13.40% | -26.70% | ||||||
| 2016 | -19.40% | -12.20% | -31.60% | ||||||
| 2017 | -20.90% | -15.50% | -30.50% | ||||||
| 2018 | -22.00% | -15.90% | -31.80% | ||||||
| 2019 | -19.20% | -13.20% | -30.20% | ||||||
| 2020 | -21.60% | -15.20% | -33.80% | ||||||
| 2021 | -23.5% | -17.1% | -35.2% | ||||||
| 2022 | -26.4% | -21.3% | -36.6% |
The data below can be saved or copied directly into Excel.